In my previous life as an associate account executive at an advertising agency, my days were filled with performance metrics. I spent hours in Excel, even the most creative of team brainstorming sessions included discussions of analytics, and I dreamed in test-control scenarios.
Our agency was a bit unique, in that we had a sister company in the same building, owned by the same owner, that fielded inbound marketing calls from the very advertising we put out in the market. In other words, my team created some direct mail asking recipients to call a number for more information, and when they called they were talking to our neighbors down the hall. This was an excessively beneficial relationship as it allowed us to get up-to-the minute data about who was calling which numbers (we put a different number on every iteration of mail, TV, radio, etc. It was dizzying); data that we shared with our clients to make ourselves look really smart and awesome, and data that we used to inform future campaigns.
Although the sample sizes and data were much more sophisticated then (our mailings were in the millions), I still use some of these principles today to test aspects of my social media campaigns, like how do Twitter ads really effect our followership and interactions, would posting a few hours later in the day improve our Facebook Reach and Engaged Users, and does posting through a third-party app (like Hootsuite) cause our Facebook posts to be hidden from our Friends?
What to test
Ideally, your test item would only have one variable different from your ‘control’–your best-performing piece or strategy to date. Yes, this can be extremely tedious, because you can only test one tiny little thing at a time. But this will help you say, more conclusively, what exactly it was that caused the difference between your control and test. If you change 7 things, you’ll have no clue as to which one caused an improvement or decrease in response. Your changes could be:
- the format (an envelope versus a postcard)
- the message
- the design (fonts, layout, color vs. black and white, different images, etc–in social media it could be including images with every post)
- the timing (if this is mail, we can only test in generalities because of the system, you can’t hang your hat on a specific day , but you could try for 2 weeks after the last thing we sent you.)
- probably anything you can think of changing
When/who to test
In the agency, we used an 80/20 approach to test new ideas: 80% of our audience would get our ‘control’ piece while the remaining 20% received our new test piece. This was mostly to insulate us from a dud–if the test piece performed horribly, only 20% of our audience would be affected by it, and we’d still have 80% working with our best performer.
If you have a large following on social media to divide up, you could look at your likes/follows by geography and try to find one (or multiple) regions that are roughly 20% of your total following–then send your test message just to these groups. You can certainly do this through Facebook and Twitter ads, but I’m not sure it can be done organically (your unpaid, regular posts). If anyone has tips here, please share!
However, segmenting by something like geography could skew your results; ideally your test audience is a perfect representation of your total audience. For example, if you send a test ad to only people who live in Brazil, and they respond to it more than everyone else responds to your control ad, is it because the test ad is better? Or maybe people in Brazil click on ads more in general. Or maybe it was lunch time in Brazil and everyone was killing time on Facebook. See? Tricky.
If you don’t have an audience large enough to segment, or it’s just too much to think about (guilty!), the best you can do is run a test on your whole audience, with as few variables as possible. I like to run tests for two weeks, and compare them to the two weeks directly before the test started (and after, if I haven’t started a new test). This will ensure that there will be enough data to normalize any flukes a little (if everyone went on a Facebook strike on the first Monday, at least you’d have a second Monday to pull data from), and if the test really bombs you haven’t lost that much time.
What to do next
Once you’ve run your test to your heart’s content, reviewed the results and come to some kind of conclusion (The test was successful! The test didn’t work as well as the control! The test maybe worked but we need to test something different to check! The test is ruining my life!), your next step is pretty simple: if the test did better than the control, use whatever you tested from now on. It becomes your new control, in fact. If the test didn’t work so great, chuck it and stick with your control strategy. Test some new things. Rinse. Repeat. Keep testing to see if you can get any more out of your marketing channels, until you can’t think of anything else to test. Then you’ve won at social media marketing. Congrats.
Direct mail example:
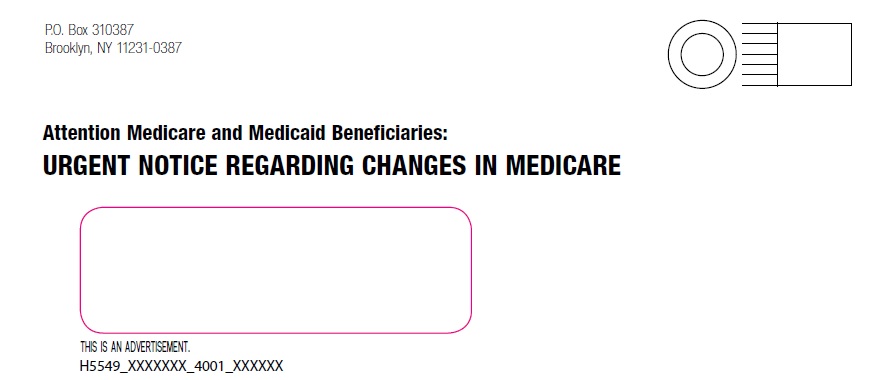
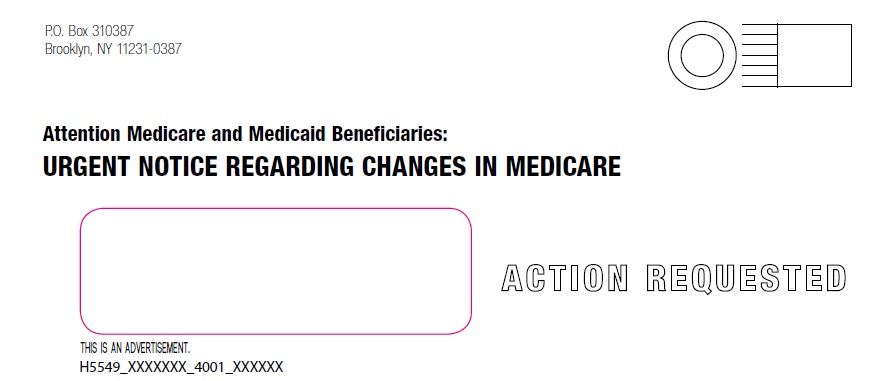
Using a traditional direct mail approach, let’s say these are our two pieces: the control and test envelopes for a piece of direct mail (yes, these are actual pieces actually mailed to people to try and get them to sign up for Medicare Part C plans. Yuck). The only difference here is what’s happening in the lower right area–nothing in the control and a scary stamp-looking thing in the test. We actually called this kind of envelope a scary envelope. Because it was meant to scare you into opening it, looking all official and urgent and time-sensitive.
So we send these out into the world and wait. We look at our results, whatever is most important to us (or likely a combination of): response rate, conversion rate–in social media it might be reach, engagement, number of shares or retweets, clickthrough rate, purchases from a link, etc.
Let’s say the test did not improve on the control:
- Control response rate: 2.1% (that’s pretty bitchin’, unfortunately)
- Test A response rate: 0.4%
Sad. So we put Test A in a bin labeled “Don’t try this again!” or probably, “Don’t try this again unless you have a really convincing reason.” Then we try something different.

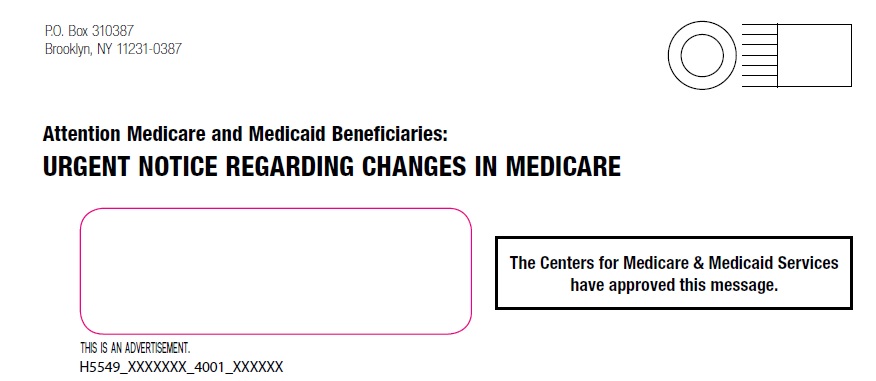
See what we did there? A different thing in the lower right area, this time with a box and nicer font. Still a little scary, though. And misleading. But that’s fine. Then maybe our results are:
- Control response rate: 2.0%
- Test A response rate: 0.6%
Drats. Still our control. Then we get a little crazy with it, like maybe testing…
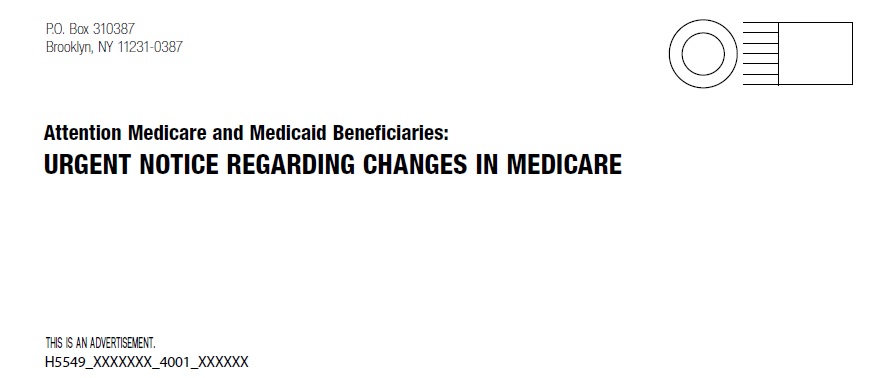
…an envelope without a window! Just think! Or even…
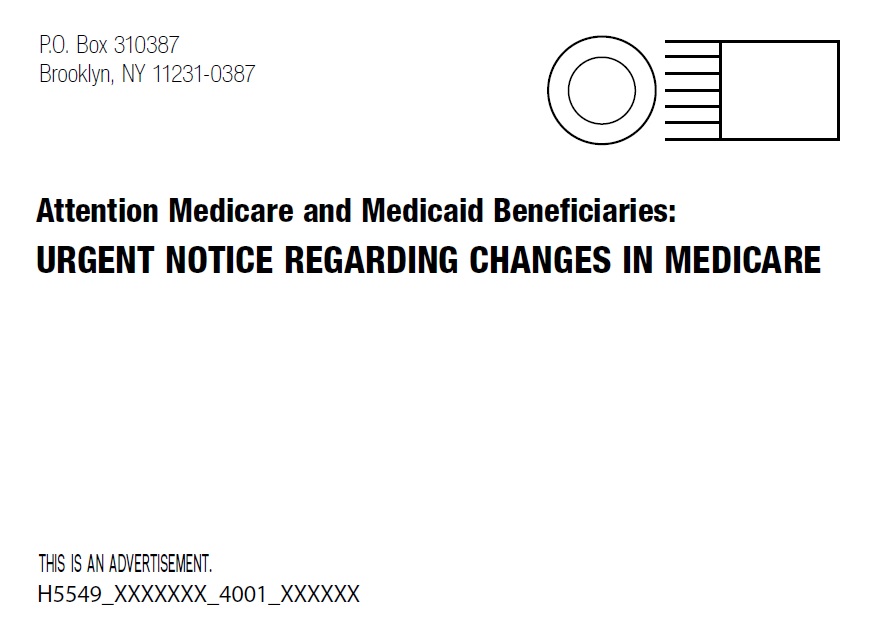
…a postcard! The humanity!
And we just keep going, tweaking one little thing at a time until we have an ultimate champion. And then we start all over next selling season. You can see how it gets tedious, but the basic principle is: try changing one thing at a time, compare it to the same time period/similar audience as before, and adjust your strategy to include whatever works best.
Rinse. Repeat.


