I’ve been managing the social media accounts for an upcoming documentary (Seriously! a movie about play) for about six months now, and in February my client and I noticed that a few Facebook posts really flopped (reach in the 10-30 range, when our average was in the 350s). The type and quality of posts didn’t seem to be vastly different from the other items we share, so we wondered if something was going on.
My first guess was that our followers were interacting with Facebook later in the day than previously–it just seemed like posts were gaining speed later in the day, and the post that really raised the flag was sent at 8:20am (PST). I decided to run a two week test to see if I could back up this hunch with some data (delicious, delicious data).
For two weeks, I posted items to Facebook a few hours later in the day than I had been used to. I didn’t have a set schedule, but generally I’d been posting once in the 8am-11am range, and again in the 12pm-3pm range. For the two weeks during the test, I tried shifting this by a few hours, so the first post fell from 10am-12pm and the second was from 3-5pm or even later.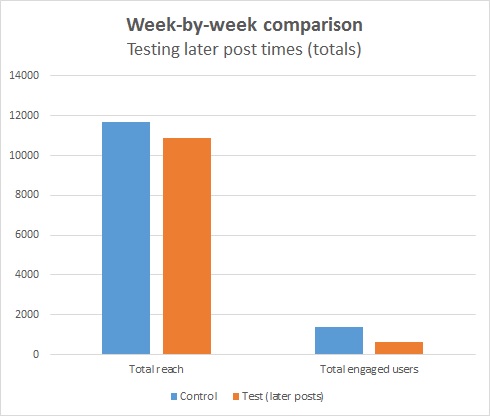
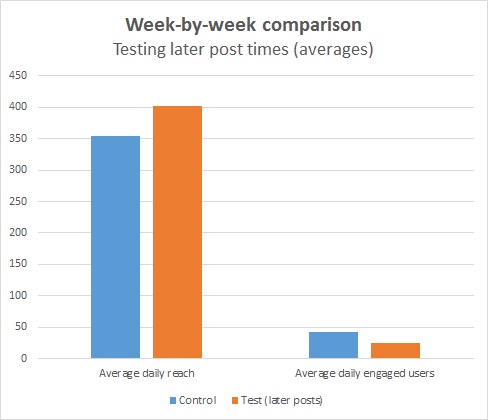
Overall, I found that during the test:
- Total reach decreased 7%
- Total engagement decreased 53%
- Average daily reach increased 13%
- Average daily engagement decreased 43%
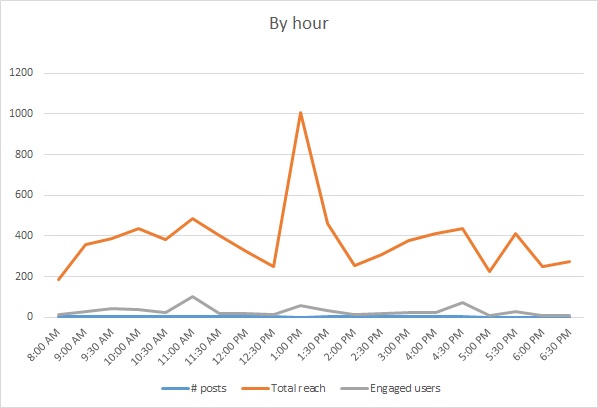
Whomp whomp. So it seems like just posting a few hours later in the day caused most of our metrics to decrease, with the exception of our average daily reach. We had one outlier during the test that had a reach of 1009, compared to the overall average of 376–this may explain why the average daily reach was positively affected during the test while everything else was negative.
Although these results didn’t give me a quick fix, it did lead to some other conclusions.
Time of day
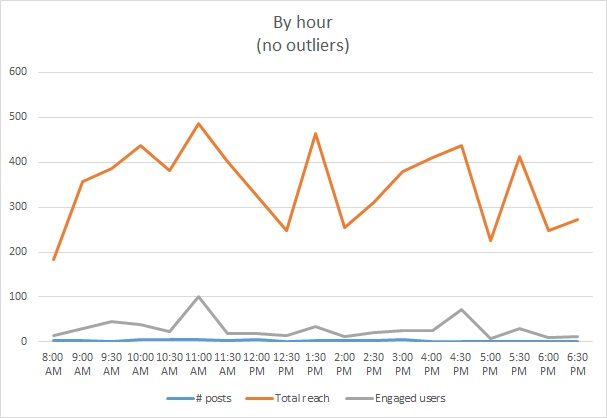
When I looked at all of our posts (for the two weeks during and before the test) by when they were sent, I found that there do indeed seem to be times during the day that garner more reach and engagement.
Our highest average reach occurred on posts sent at 1pm, 11am, 1:30pm, and 10am or 4:30pm (in that order–“or” indicates a tie), while we saw the most engaged users on posts sent at 11am, 4:30pm, and 1pm.
We did have that outlier post during the test week, and you can see from this graph with outlier data removed that the outlier caused that big spike at 1pm–in fact it was the only post during these four weeks sent at 1pm.
Without the outlier, you can take 1pm out of our highest average reach list and add 5:30 or 4pm at the end. For engaged users, we would replace 1pm with 9:30am followed by 1:30pm.
We didn’t have a lot of data for the later times, and nothing after 6:30pm, so I will make a point to post more often later in the day for future analysis.
Day of the week
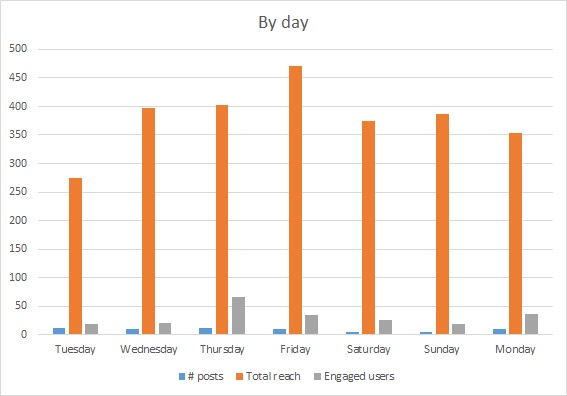
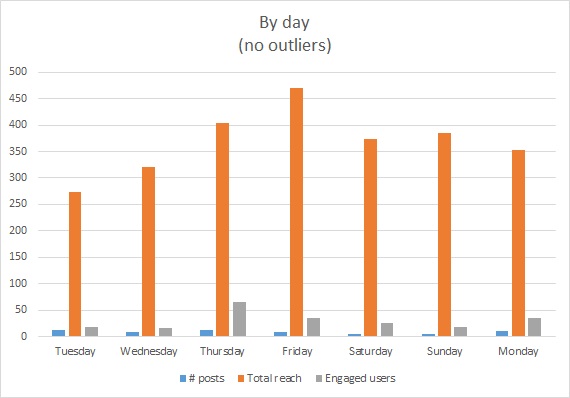
Similarly, I looked at which days of the week saw the highest average reach and engaged users.
You can see from these two graphs that the outlier didn’t have as great an effect on day of the week data (thanks to more data for each day of the week than there was for each half-hour in a day).
So, our highest average reach came on posts sent on Fridays, Thursday, Sundays, and Saturdays, while posts with the highest average number of engaged users happened on Thursdays, Fridays or Mondays. I guess I ordered the days of the week this way because it almost looks like a bell curve and that just feels right, doesn’t it?
Post frequency
Finally, and mostly for funsies, I wanted to see if there was a relationship between the number of times I posted during a day and our average reach/engagement.
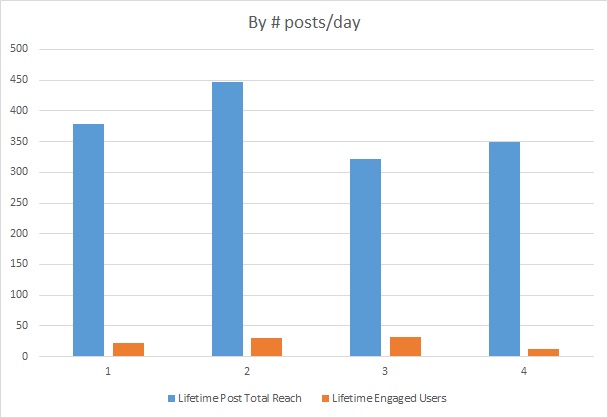
This shows that on days when we posted twice, we had the highest average daily reach, and on days when we posted two or three times we had the highest average daily engagement.
Strategy
From this seemingly unsuccessful test, I pulled some interesting bits of strategy to give our posts the best chance of success.
- Post two or three times each day
- Send posts between 9:30am and 11am, 1-1:30pm, and 4-5:30pm
- Post more often or save some really good posts for Thursday, Fridays, and Mondays
- Test even later posts (as mentioned above)
If you want to run your own test, I’ll write up some simple testing tips–and I can share how to combine Facebook data to look at time, day, and frequency results if anyone’s interested.


