I think in another life I could have been an economist. Data makes me feel safe and happy. Luckily, marketing is full of data, and if you treat social media as one of your marketing channels, it, too can provide a delicious data-splosion for you.
What metrics to track is up to you, and should be tied to your social media goals. As a starting point, I thought I’d share what I’ve been tracking as I manage the Facebook and Twitter accounts for an upcoming documentary about play (Seriously! the movie – check out our Facebook and Twitter profiles).
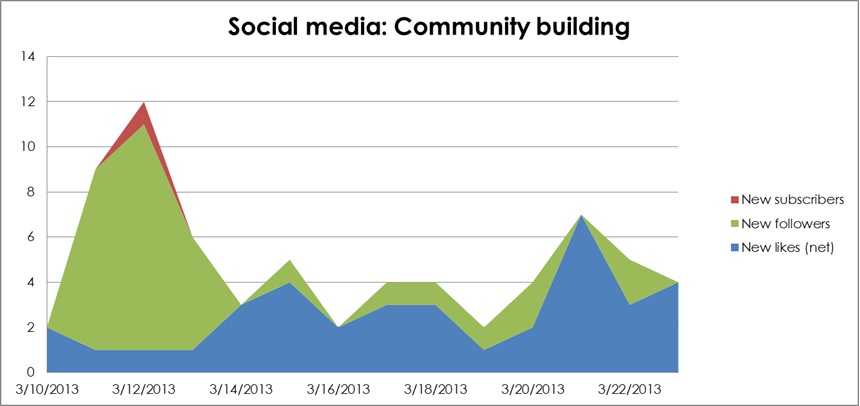
Our goals for social media and the metrics I use to track them are:
- Grow a community–measured by likes/followers/subscribers
- Encourage an engaged community–measured by engagement & interaction
- Develop a clear and distinct brand–this one is trickier, I use traffic driven to the website from social media and a more subjective gut-check from the doc’s director (whether she feels like our messaging supports our brand)
That being said, I track a lot of other stuff too. The bonus of tracking across so many different channels is that more information is…more…information. For instance if I see a spike in Facebook likes I can see if there is a similar spike on Twitter, or if there’s a boost in visits to the website I can see if that corresponds to a lot of engagement on Facebook.
All charts below were created in Excel, where I keep all of this tasty data together.
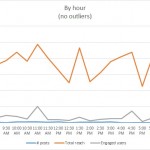
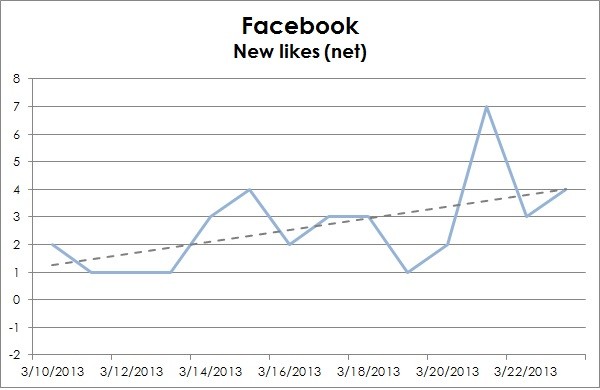
Tracked: total/new likes, total reach, and talking about this.
These are handily found on your Facebook page ‘insights.’ New likes are a daily number, while total reach (how many people saw your posts) and talking about this (how many people interacted with your post–liked it, shared it, commented, etc–this is the engagement measurement I use most) are totals for the week leading up to the day it’s reported. I track net daily likes as one number, although Facebook will tell you both new likes and unlikes per day.
You can also export a whole messload of other data from Facebook, but these three are the easiest to access (no downloading required) and serve my purposes.
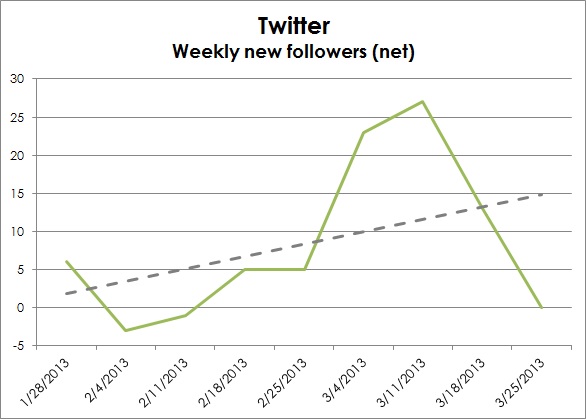
Tracked: total/new follows, unfollows, and interactions.
Right now I’m doing all of this by hand, because we’re on a tight budget and I haven’t found a good free tool yet–let me know if I’m missing something! The tricky thing about Twitter is that it doesn’t necessarily tell you exactly when a person started following you (on your ‘@’ tab, it groups new followers every couple of days unless you have a ton of new follows every day). If you let Twitter email you about new follows, you might have a more accurate daily count, but I just to be safe I look at new followers by week. Twitter also doesn’t tell you when someone stops following you, so I use the free service Qwitter–they’ll email you this number weekly.
I count all responses, mentions, retweets, and favorites as interactions, which I also just tally up by hand.
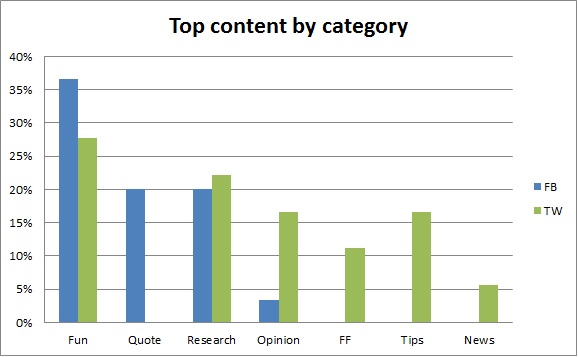
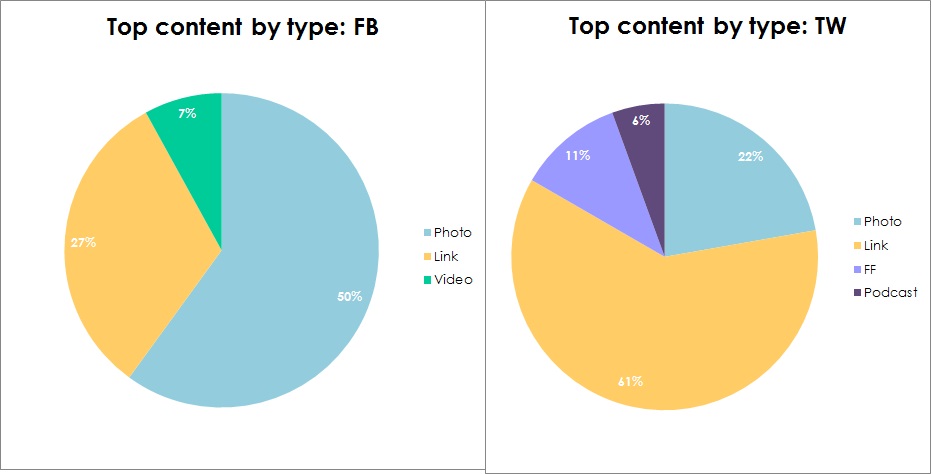
Top content
Each week, I look for the post that was the most popular on Facebook and on Twitter (each, not overall) and note them in a set of metrics I named ‘Top content.’ I put each post into a content category–whether it’s a bit of research, an opinion piece, a quote, or just a fun thing–and into a content type–link, photo, video, etc.
This is my way of seeing what kinds of content become very popular on these two channels, which helps me strategize to keep feeding our audience what they like. Nom nom.
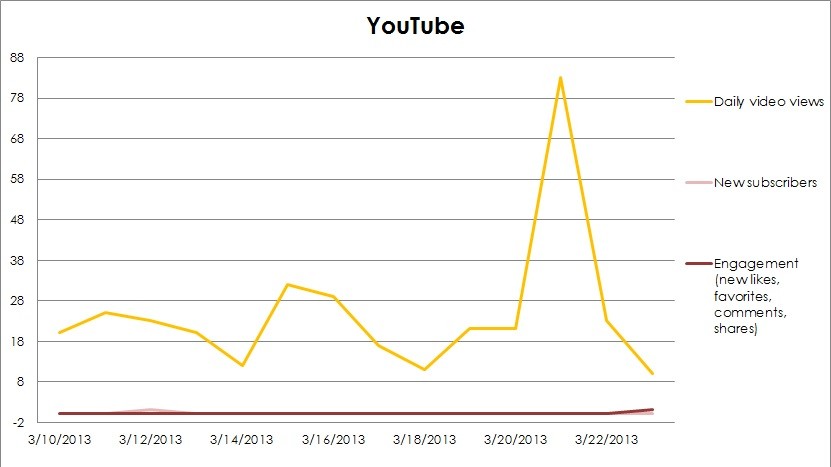
YouTube
Tracked: total/new subscribers, daily video views, engagement
These are easily imported from YouTube, on your channel page under the ‘analytics’ link. Engagement is a sum of likes, favorites, comments, and shares.
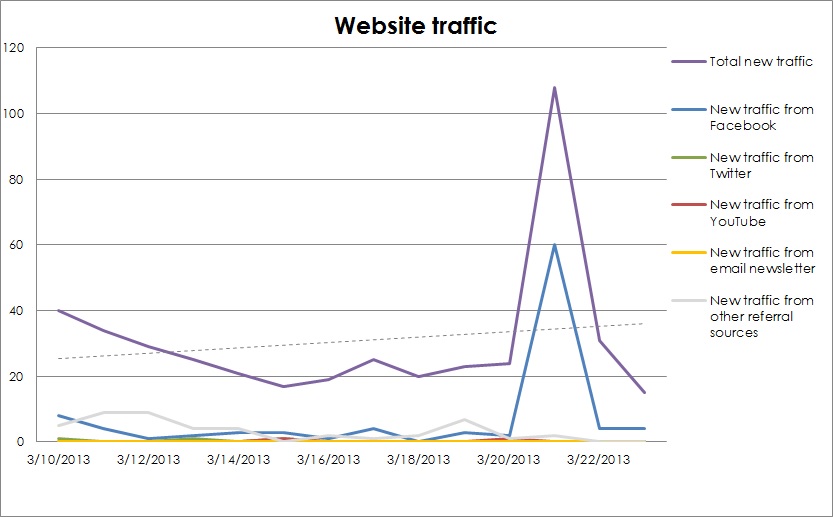
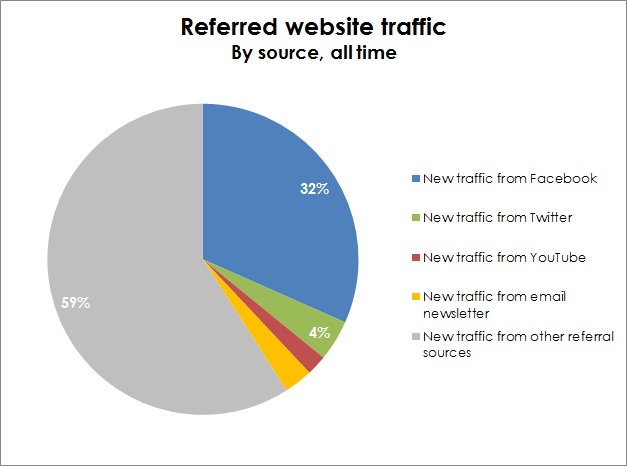
Website
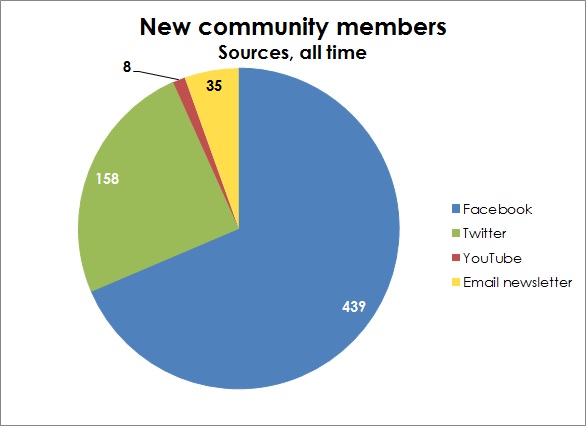
Tracked: new traffic, new traffic from Facebook, Twitter, YouTube, and all social media, new traffic from email newsletter, new traffic from other referral sources
As soon as ever I was able, I threw some Google Analytics on the Seriously! website. Google Analytics are like D’s to me. As in: throw some D’s on it. Those D’s. So all of these are pretty easy to find:
- new traffic–probably the first thing you’ll see, but if you loose it just go to Audience > Overview
- new traffic from Facebook/Twitter/YouTube–under Traffic Sources > Sources > Referrals. To make it a little easier to see, in the search bar right between your graph and your data, type the source you want to see to filter everything else out. Twitter usually shows up as t.co.
- new traffic from all social media–this is just a sum of the previous
- new traffic from email newsletter–we use MailChimp to send out our newsletter, and you can add a Google tracking code to each email if you want (Google it for instruction ;). In Google Analytics, you can find the results under Traffic Sources > Sources > Campaigns
- new traffic from other referral sources–this puts the other stats in perspective for me. To find this: under Traffic Sources > Sources > Referrals, then under ‘advanced’ set it to ‘Exclude’ ‘Sources’ ‘Containing’ and type in facebook, then ‘add a dimension’ with t.co, then another for youtube and another for any other sources you want to exclude.
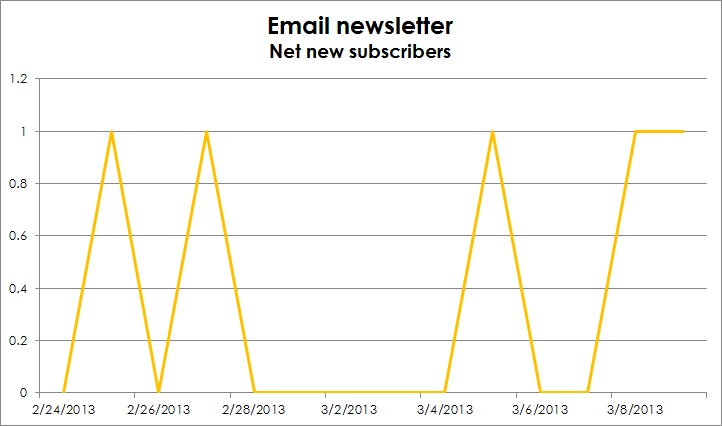
Email newsletter
Tracked: total/new subscribers
Pretty self-explanatory.
Helpful? Not helpful? Questions/suggestion? Happy to hear ’em!